

FirstFiber Technologies OTDR Optical Fiber Cable Monitoring System
System Overview
The OTDR Network Management System (NMS) is an advanced platform designed for real-time fiber optic link monitoring, automated testing, fault detection, and alert management. It provides a visual interface to manage multiple OTDR hardware modules, analyze fiber curves, and maintain network health.
Global Dashboard (🌐 Global Dashboard)
The dashboard provides a bird’s-eye view of your entire fiber network.
Metrics at a Glance
Track the Total Managed Devices, Healthy Nodes (Green), Alert Nodes (Red), and Active Schedules (Purple).
Real-Time Node Status Table
View the health status, bound routes, active schedules, and last test times of all registered OTDR modules. Click “Console ➡️” to jump directly to a specific module’s control panel.
Refresh Status
Use the manual refresh button to fetch the latest network topology and device health data.
Device & Route Management
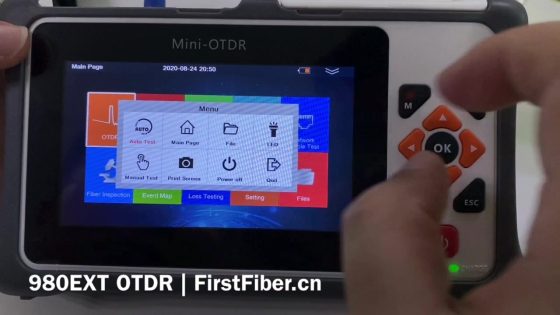
Managing OTDR Modules
Add a Module
In the Device Control tab, click + Add. Enter a recognizable alias, the physical IP address, and the port (default is 5000) of the OTDR hardware. Click Save Module.
Delete a Module
Select a module from the dropdown and click the 🗑️ (Trash) icon.
GIS Route Library & Binding
Create a Route
Navigate to the GIS Route Library section. Click + New Route, then click ✏️ Start Drawing. Click on the map to define the fiber path (minimum 2 nodes). Click 💾 Save Route Coords and provide a name.
Bind to Module
Select a route from the dropdown and click 🔗 Bind to Module to link the physical OTDR hardware to the geographical map path.
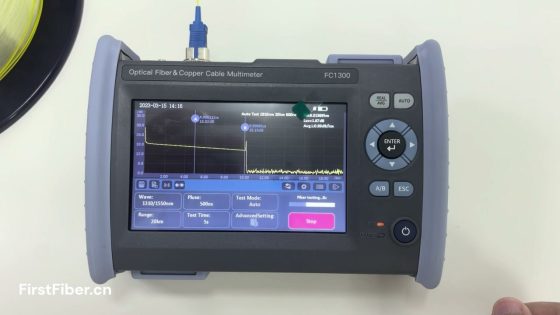
Testing & Measurement
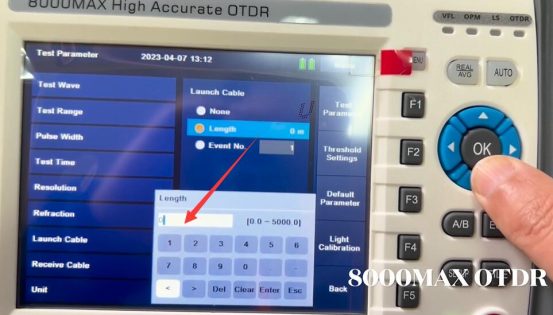
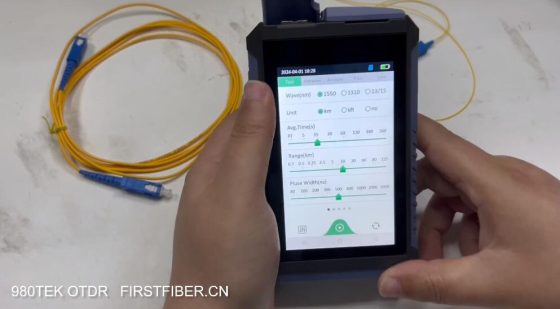
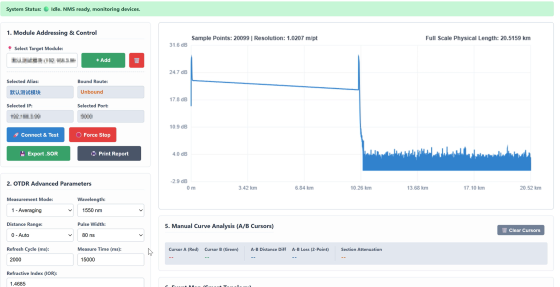
Advanced Parameters
Before initiating a test, configure the core OTDR parameters
Measurement Mode
Choose between Averaging (1) or Real-time (2).
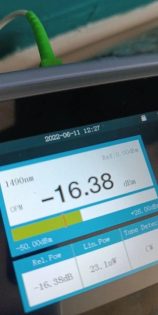
Wavelength / Range / Pulse Width
Select the appropriate testing wavelength (e.g., 1550nm), distance range (or Auto), and pulse width.
Refractive Index (IOR)
Adjust the Index of Refraction (default 1.4685) to match your specific fiber cable for accurate distance calculation.
Execution and Export
Connect & Test
Click 🚀 Connect & Test to send parameters to the hardware and begin scanning.
Force Stop
Click 🛑 Force Stop to immediately halt an ongoing measurement.
Export Data
Use 💾 Export .SOR to download standard Bellcore GR-196 binary files, or click 🖨️ Print Report to generate a printable PDF summary of the test.
Data Analysis
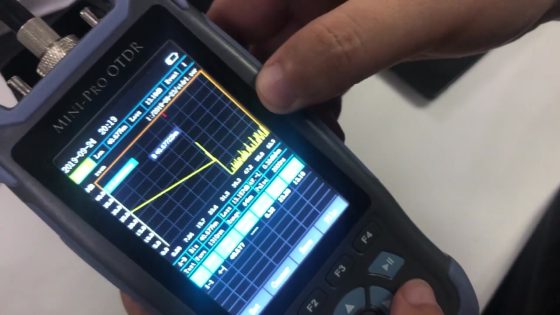
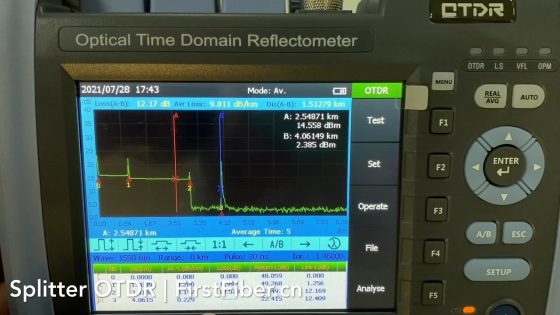
Manual Curve Analysis (A/B Cursors)
Hover over the measurement curve to view precise points. Click on the curve to place Cursor A (Red) and Cursor B (Green). The system will automatically calculate the physical distance difference, 2-point loss (dB), and section attenuation (dB/km). Click 🗑️ Clear Cursors to reset.
Event Map & Event Table
Event Map
Provides a simplified, linear visualization of fiber events, including the Start Event (🟢), Reflective Events (🟦), Non-reflective Splice/Loss (✖️), and the Fiber End (🏁).
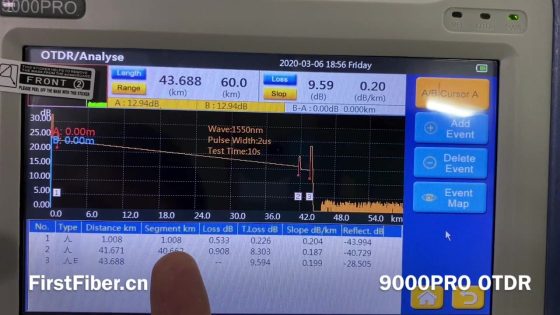
Event Table
A detailed tabular breakdown showing physical distances, insertion loss, return loss, attenuation, and cumulative total loss for every detected event.
History, Baselines & Automation
Historical Records & Baseline
Every successful scan is automatically saved locally. You can view these in the Historical Records list.
Replay (👁️ View)
Replay a historical measurement curve to view past network conditions.
Set Baseline (🌟 Set Baseline)
Designate a specific healthy scan as the baseline template. Future scans will be compared against this template to detect distance or loss anomalies.
Auto Schedules & Alerts
Schedules
Set an interval (e.g., 60 minutes) and click ▶️ Start to enable automated background polling for a module.
SMTP Alerts
Configure your SMTP server, sender email, authorization code, and recipient emails in the SMTP Alert Email Config section. If a scheduled scan deviates from the Baseline Template, an alert email containing fault details will be automatically dispatched.
The system is developped for the OTDR module. See specifications.


Comments are closed.